A Third Bank Joins The Doom Chorus, Sees Painful Correction In 3 Months: Here’s Why
Quietly, one bank after another is telling its clients that the music is about to end.
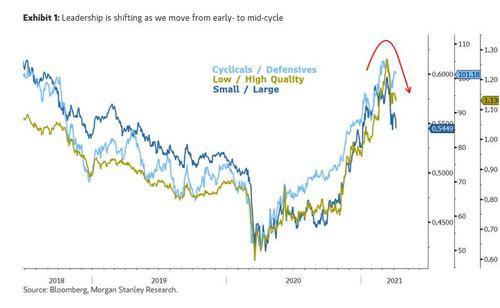
It started with Morgan Stanley, whose chief equity strategist Michael Wilson over the weekend said that while the S&P 500 has continued to make new all-time highs, “underneath the surface, there has been a noticeable shift in leadership which could be telling us something about the reopening that may not be obvious.” More specifically, the Russell 2000 small cap index has underperformed the S&P 500 by 8% since peaking on March 12. While this follows a period of historically strong outperformance, when relative strength like this breaks down, Wilson said that he has taken notice. Furthermore, some of the cyclical parts of the equity market we have been recommending for over a year are starting to underperform, while defensives are doing a bit better. If that weren’t enough, indices of IPOs and SPACs have underperformed by 20% and are both down for the year.
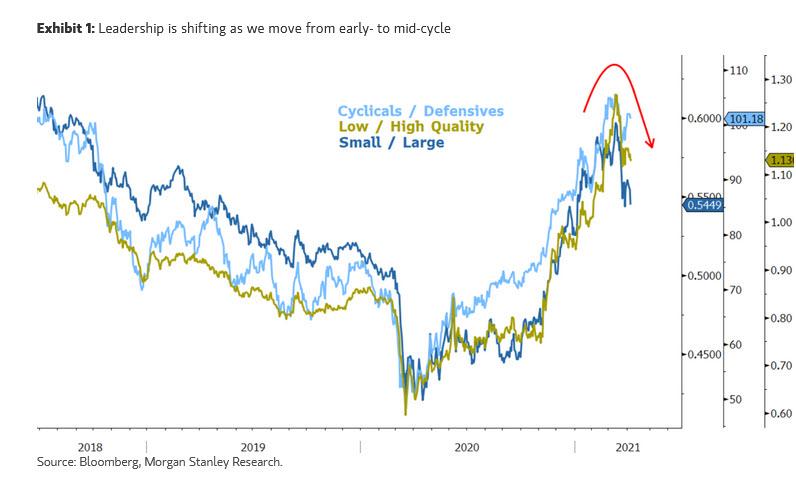
But wait, there’s more: as the once most bullish Wall Street analyst warned, the breakdown of small caps and cyclicals is “a potential early warning sign that the actual reopening of the economy will be more difficult than dreaming about it” as small caps and cyclicals have been stellar outperformers over the past year. In essence, they were discounting the recovery and reopening that we are about to experience. However, “now we must actually do it and with that comes execution risk and potential surprises that aren’t priced.”
And here a big problem emerges: while policymakers have provided tremendous support for the economy with both monetary accommodation and fiscal stimulus, the lockdowns have reduced supply, destroying it in some cases, and sending prices soaring while hammering profit margins.
As a result, we are now seeing evidence of supply shortages in everything from materials and logistical support to labor. The punchline is that 1Q earnings season may bring bad news on costs and margins, particularly with respect to 2Q outlooks. We’ve been writing about this risk for weeks and believe it will be idiosyncratic in how it plays out, with some companies executing well while others don’t.
Meanwhile, the underperformance in IPOs and SPACs is to Wilson “a signal that the excessive liquidity provided by the Fed is finally being overwhelmed by supply” who ominously notes that his experience is that “when new issues underperform this much, it’s generally a leading indicator that equity markets will struggle more broadly.” When combined with the fact that leverage in the system is very high, it could spell more trouble for riskier, more speculative investments, he concludes.
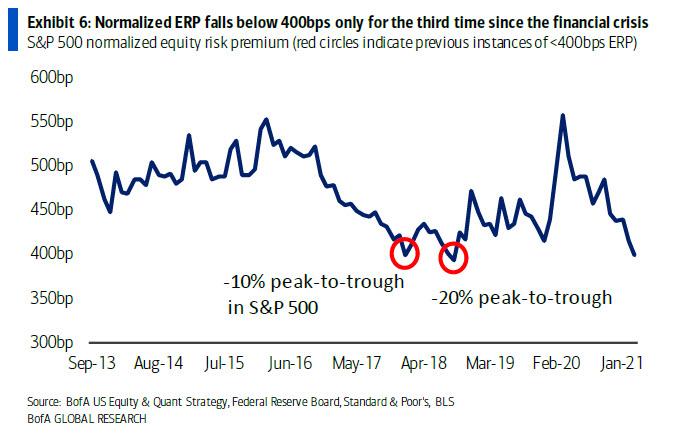
Morgan Stanley’s concern was repeated by Bank of America whose chief quant and equity strategist Savita Subramanian today published a piece titled “Five Reasons To Curb Your Enthusiasm” (which we discussed earlier today) in which she said that “amid increasingly euphoric sentiment, lofty valuations, and peak stimulus, we continue to believe the market has overly priced in the good news. We remain bullish the economy but not the S&P 500.“
She then listed 5 reasons why stocks are priced to absolute perfection and reality will most likely disappoint, including: i) the bank’s sell side Indicator
Bottom line: while an amused Subramanian jokingly notes that in another measure of Wall Street bullishness: “we’re tied for last place among strategists’ forecast for the S&P 500”, she is quite happy with her year-end S&P500 target of 3,800, some 9% below today’s closing price.
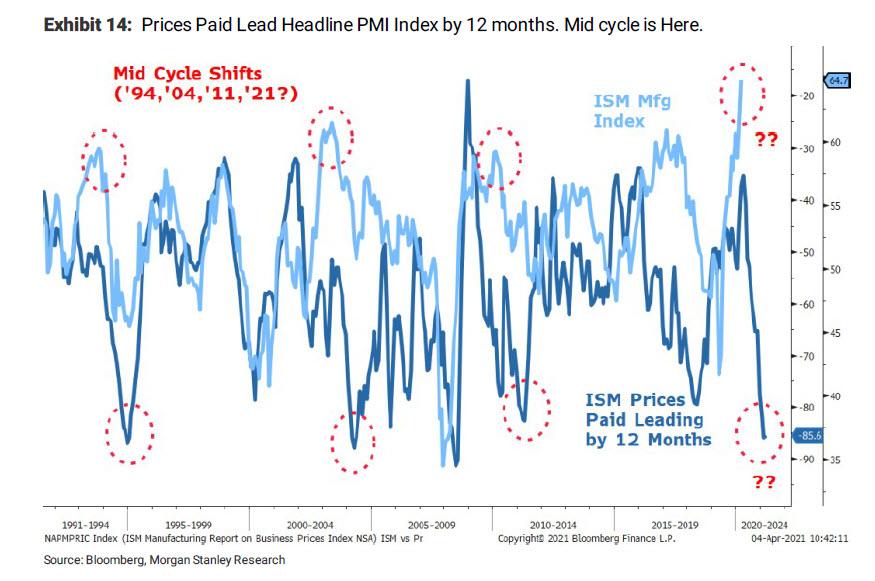
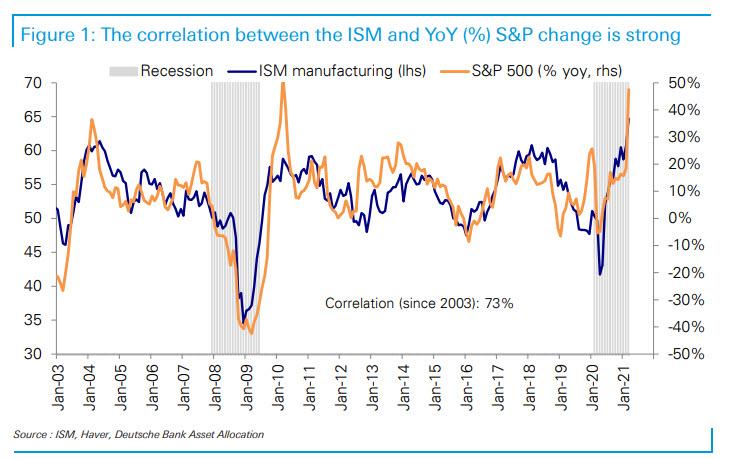
And now a third bank has joined the ominous chorus. In a recent note from Deutsche Bank’s chief equity strategist Binky Chadha, “When Growth Peaks”, he writes that historically, qquities have traded closely with indicators of cyclical macro growth such as the ISMs (correlation 73%), and growth (ISM) typically peaks around a year (10-11 months) after recession ends, “right at the point we would appear to be.”
As a result, “very near term”, Deutsche Bank expects equities to continue to be well supported by the acceleration in macro growth, and see buying by systematic strategies and buybacks driving a grind higher, however, the bank also now expects a “significant consolidation (-6% to -10%) as growth peaks over the next 3 months.”
The chart below shows a strong correlation between the ISM and equities and the simplified view is that when the ISM peaks a correction is likely. As noted above, Binky’s team has identified 36 peaks in the ISM in the post-WWII period. Two-thirds of these peaks (24) were an inverted-V shape, while the rest (8) saw the ISM stop rising and flatten out at an elevated level.
Excluding episodes of a declining ISM that eventually ended in recessions, which currently appears unlikely and which led to far lower stock prices anyway, the S&P 500 sold off around these growth peaks by a median of -8.4%. But even episodes which saw the ISM flatten out rather than fall, saw a median -5.9% sell-off.
Finally, and perhaps most importantly, in terms of timing the sell-off began a median 2 weeks after the peak in the ISM and lasted for a median of 6 weeks.
Although using historical experience as a guide argues for a near -6% pullback if growth flattens out near the peak, given positioning is unusually elevated so early in this expansion, Binky thinks the correction could be materially larger than average and in the 6-10% range.
The good news is that with that hiccup out of the way, things return back to normal, and after this correction, the DB strategist says that “the ongoing strong growth means that equities will rally back” and later in the year the risks are mostly based around inflation and the Fed’s response.
Tyler Durden
Wed, 04/14/2021 – 20:20
A Third Bank Joins The Doom Chorus, Sees Painful Correction In 3 Months: Here’s Why
Quietly, one bank after another is telling its clients that the music is about to end.
It started with Morgan Stanley, whose chief equity strategist Michael Wilson over the weekend said that while the S&P 500 has continued to make new all-time highs, “underneath the surface, there has been a noticeable shift in leadership which could be telling us something about the reopening that may not be obvious.” More specifically, the Russell 2000 small cap index has underperformed the S&P 500 by 8% since peaking on March 12. While this follows a period of historically strong outperformance, when relative strength like this breaks down, Wilson said that he has taken notice. Furthermore, some of the cyclical parts of the equity market we have been recommending for over a year are starting to underperform, while defensives are doing a bit better. If that weren’t enough, indices of IPOs and SPACs have underperformed by 20% and are both down for the year.
But wait, there’s more: as the once most bullish Wall Street analyst warned, the breakdown of small caps and cyclicals is “a potential early warning sign that the actual reopening of the economy will be more difficult than dreaming about it” as small caps and cyclicals have been stellar outperformers over the past year. In essence, they were discounting the recovery and reopening that we are about to experience. However, “now we must actually do it and with that comes execution risk and potential surprises that aren’t priced.”
And here a big problem emerges: while policymakers have provided tremendous support for the economy with both monetary accommodation and fiscal stimulus, the lockdowns have reduced supply, destroying it in some cases, and sending prices soaring while hammering profit margins.
As a result, we are now seeing evidence of supply shortages in everything from materials and logistical support to labor. The punchline is that 1Q earnings season may bring bad news on costs and margins, particularly with respect to 2Q outlooks. We’ve been writing about this risk for weeks and believe it will be idiosyncratic in how it plays out, with some companies executing well while others don’t.
Meanwhile, the underperformance in IPOs and SPACs is to Wilson “a signal that the excessive liquidity provided by the Fed is finally being overwhelmed by supply” who ominously notes that his experience is that “when new issues underperform this much, it’s generally a leading indicator that equity markets will struggle more broadly.” When combined with the fact that leverage in the system is very high, it could spell more trouble for riskier, more speculative investments, he concludes.
Morgan Stanley’s concern was repeated by Bank of America whose chief quant and equity strategist Savita Subramanian today published a piece titled “Five Reasons To Curb Your Enthusiasm” (which we discussed earlier today) in which she said that “amid increasingly euphoric sentiment, lofty valuations, and peak stimulus, we continue to believe the market has overly priced in the good news. We remain bullish the economy but not the S&P 500.”
She then listed 5 reasons why stocks are priced to absolute perfection and reality will most likely disappoint, including: i) the bank’s sell side Indicator
Bottom line: while an amused Subramanian jokingly notes that in another measure of Wall Street bullishness: “we’re tied for last place among strategists’ forecast for the S&P 500”, she is quite happy with her year-end S&P500 target of 3,800, some 9% below today’s closing price.
And now a third bank has joined the ominous chorus. In a recent note from Deutsche Bank’s chief equity strategist Binky Chadha, “When Growth Peaks”, he writes that historically, qquities have traded closely with indicators of cyclical macro growth such as the ISMs (correlation 73%), and growth (ISM) typically peaks around a year (10-11 months) after recession ends, “right at the point we would appear to be.”
As a result, “very near term”, Deutsche Bank expects equities to continue to be well supported by the acceleration in macro growth, and see buying by systematic strategies and buybacks driving a grind higher, however, the bank also now expects a “significant consolidation (-6% to -10%) as growth peaks over the next 3 months.”
The chart below shows a strong correlation between the ISM and equities and the simplified view is that when the ISM peaks a correction is likely. As noted above, Binky’s team has identified 36 peaks in the ISM in the post-WWII period. Two-thirds of these peaks (24) were an inverted-V shape, while the rest (8) saw the ISM stop rising and flatten out at an elevated level.
Excluding episodes of a declining ISM that eventually ended in recessions, which currently appears unlikely and which led to far lower stock prices anyway, the S&P 500 sold off around these growth peaks by a median of -8.4%. But even episodes which saw the ISM flatten out rather than fall, saw a median -5.9% sell-off.
Finally, and perhaps most importantly, in terms of timing the sell-off began a median 2 weeks after the peak in the ISM and lasted for a median of 6 weeks.
Although using historical experience as a guide argues for a near -6% pullback if growth flattens out near the peak, given positioning is unusually elevated so early in this expansion, Binky thinks the correction could be materially larger than average and in the 6-10% range.
The good news is that with that hiccup out of the way, things return back to normal, and after this correction, the DB strategist says that “the ongoing strong growth means that equities will rally back” and later in the year the risks are mostly based around inflation and the Fed’s response.
Tyler Durden
Wed, 04/14/2021 – 20:20
Read More