Global Depopulation – Two Paths, One Destination
Authored by Chris Hamilton via Econimica blog,
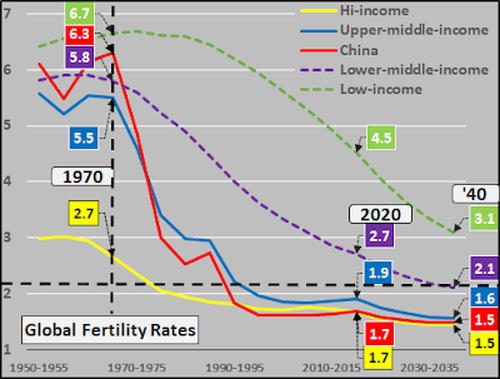
Play along with me while we consider the ultimate barometers of economic wellbeing that are fertility rates and births across the developed world, China, and the RoW (rest of the world). How fertility rates have freefallen to predominantly negative rates. How the developed nations fertility rates turned negative first, then China, then most the RoW (& soon nearly the entire world).
A quick perusal of the chart of global fertility rates, by income groups below, shows a sharp and sustained drop in global fertility since 1970. It is well understood how (and why) China did this…less well understood how (and why) the developed world got there first and has sustained it for decades. My supposition is that declining fertility rates worldwide are primarily due to central bank set interest rate policies which have consistently encouraged debt and asset inflation well ahead of real income inflation. These rising costs of living have particularly punished those with little or no offsetting assets…chief among these, young adults among the childbearing population. The decades long squeeze has slowed marriages to a crawl and sent births tumbling. Given family formation and childbirth are a choice now with widely available contraception…the choice is increasingly, no.
Data below is from UN World Population Prospects 2019…future fertility and birth estimates are a more realistic average between UN median and low estimates.

Below, annual births per income groupings (plus average group gross national incomes per capita are called out). Births only continue to rise among the very poorest and least able to consume. Births among all other income groups are in secular decline. From a consumption standpoint, it takes nearly 50 more poor consumers to replace the decline of every one high income consumer. The math on the ongoing declines among high consumers being replaced by low consumers does not pencil.
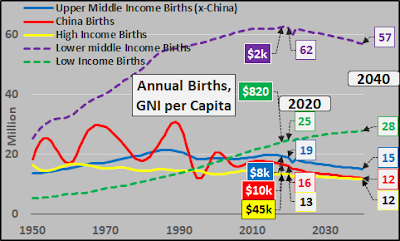
Perhaps it’s time to consider what role the Federal Reserve and developed nation central banks have had in this collapse…particularly versus the Chinese population control approach of a one child policy? The developed nations, via interest rate policy, appear to have achieved consistently lower birth rates than China’s autocratic approach. Given the stated central bank focus of environmentalism, clearly the most important component in controlling emissions, resource depletion, etc. is controlling the quantity of consumers (particularly among those that have high rates of consumption). It has been five decades in the turning of this ship…but now organic demand (quantity of 0 to 65 year old consumers w/ capability to consume) is set to fall indefinitely. Absent the population/consumer growth of the consumer nations, there is no transmission mechanism for lower middle and low income nations to export there way to higher gross national incomes, per capita. In fact, the lower middle and low income nations are likely to see their portion of the pie begin falling dramatically as developed demand for their goods and labor consistently wanes.
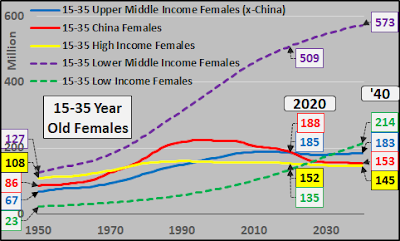
Below, the female childbearing populations of the differing income groupings. The long declining female childbearing populations of the developed (despite immigration) coupled with severely negative fertility rates versus the decelerating childbearing growth and decelerating fertility rates of the lower middle (India, etc.) and low income groupings. Like most things, there is likely a tipping point at which the lack of organic population/consumer growth can no longer be hidden by debt and population growth among the poor and elderly. We are likely there.
Seventy years of Federal Reserve interest rate policy managing the dollar as the global reserve currency…with two distinct periods. Thirty years of interest rate hikes, followed by 40 years of interest rates cuts. Below, I chart this interest rate against the basis of global demand represented by the high and low income global child bearing populations, and resultant debt that declining rates have fostered.

Looking at the same groupings, but on a year over year change basis. It appears that changing global demand (inflation) and the annual change in the global childbearing consumer population have moved in sync for…seven decades. This doesn’t seem to be a coincidence. Essentially, rates were hiked while demand growth was rapidly rising, suffocating commensurate capacity growth…pushing inflation and turning a growing population away from further population growth. Then as demand growth was decelerating, rates were dropped encouraging oversupply of new capacity…and deflation. Almost simultaneous to the onset of the declining childbearing population, ZIRP was initiated. ZIRP has ushered in asset hyper-inflation (enriching primarily institutional and elderly asset holders) amid stagflation and population decline among the consumer childbearing population…and decelerating growth among the low consumer nations childbearing population.
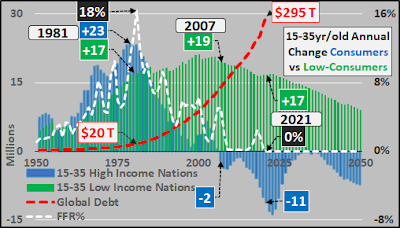
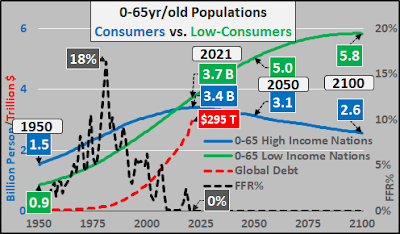
Looking at the wider consumer vs. low-consumer under 65 year old populations, FFR%, and resultant debt. The consumer supertanker, that is the consumer under 65 year old population, has turned downward…even inclusive of immigration (factored into the chart below). The decades of interest rate cuts until arriving at ZIRP and the resultant inverse relationship of debt growth are fairly easy to see…and only when viewing their impact on population growth can their true purpose be seen.
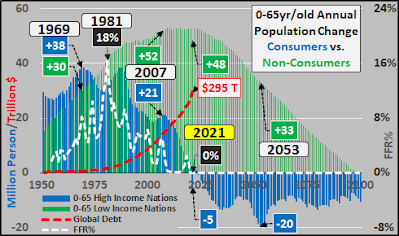
Looking at the same as above, except on a year over year annual change basis. ZIRP, exploding debt (resulting in asset hyper-inflation), and global consumer depopulation are no coincidence.
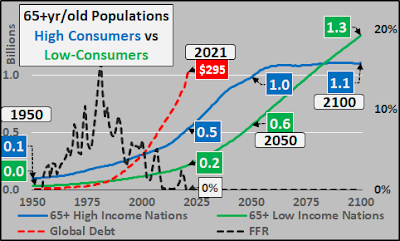
Lastly, where the majority of global population growth is happening among the elderly…essentially an echo of where the world was almost seven decades ago except this population is living decades longer than the generations that came before them. But growth among this population is massively deflationary as elderly are credit averse and tend to pay down/off their debts…essentially destroying currency faster than the young population can create money via new debt.
It would appear that the seven decades of global reserve currency management coinciding with the unprecedented downturn in fertility, births, and population growth are highly correlated. The power to artificially determine interest rates, rather than trust in a free market, has reverberations throughout business, finance, and economics. But interest rate policy also seems to have guided birth rates and ultimately the population of this planet. Like most things, I doubt the Federal Reserve would even dignify this with a comment or discussion…but the data suggesting the Federal Reserve (BoJ, ECB, BoE, etc.) has, is, and will likely continue to be guiding depopulation (in like goal to China…but differing in method), while simultaneously choosing winners/losers for decades to come, seems fairly compelling.
In case there are still those that wonder at the transmission of declining interest rates/ZIRP…to debt creation…to asset appreciation…absent resultant GDP growth…please study the charts below charts of the Wilshire 5000 (representing all US equity) which has now doubled GDP. And finally the impact of shifting wealth to the few on the births among the many.

Focus on the Wilshire 5000 (representing soaring US asset inflation).

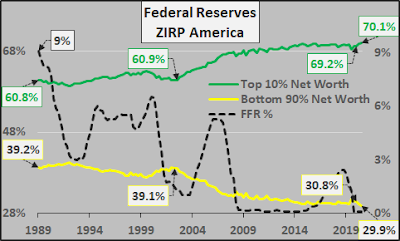
Finally, who is winning/losing based on asset inflation…chart below shows surging net worth of the top 10% of Americans (now owning over 70% of total wealth) versus declining portion among those with little to no assets (bottom 90% of Americans now holding less than 30% of the pie).
Portion of net worth by top 10% / bottom 90% versus annual US births.

Gauging US annual births (regardless parents status as legal/illegal) versus Federal Funds Rate, US marketable debt, Federal Reserve’s balance sheet (below).

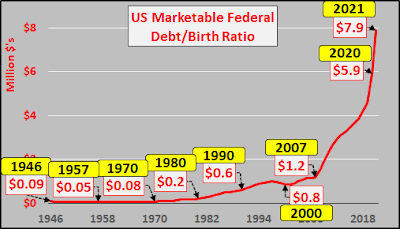
And dividing the future responsible for paying/servicing that debt (annual births) vs. the sins of the past that will be their lifelong yoke. Looking more like Bitcoin or what gold/silver would look like if their paper versions weren’t being rehypothecated even faster than currency dilution. At some point, young will refuse to carry that weight any longer (and the $ will likely suddenly, violently become worthless in terms of fixed quantities of things like physical gold/silver).
Invest accordingly!!!… even if it may be the foundation of the second American civil war (dancing in an immoral system as long as the music plays)!?!
Tyler Durden
Tue, 02/16/2021 – 13:09
Global Depopulation – Two Paths, One Destination
Authored by Chris Hamilton via Econimica blog,
Play along with me while we consider the ultimate barometers of economic wellbeing that are fertility rates and births across the developed world, China, and the RoW (rest of the world). How fertility rates have freefallen to predominantly negative rates. How the developed nations fertility rates turned negative first, then China, then most the RoW (& soon nearly the entire world).
A quick perusal of the chart of global fertility rates, by income groups below, shows a sharp and sustained drop in global fertility since 1970. It is well understood how (and why) China did this…less well understood how (and why) the developed world got there first and has sustained it for decades. My supposition is that declining fertility rates worldwide are primarily due to central bank set interest rate policies which have consistently encouraged debt and asset inflation well ahead of real income inflation. These rising costs of living have particularly punished those with little or no offsetting assets…chief among these, young adults among the childbearing population. The decades long squeeze has slowed marriages to a crawl and sent births tumbling. Given family formation and childbirth are a choice now with widely available contraception…the choice is increasingly, no.
Data below is from UN World Population Prospects 2019…future fertility and birth estimates are a more realistic average between UN median and low estimates.
Below, annual births per income groupings (plus average group gross national incomes per capita are called out). Births only continue to rise among the very poorest and least able to consume. Births among all other income groups are in secular decline. From a consumption standpoint, it takes nearly 50 more poor consumers to replace the decline of every one high income consumer. The math on the ongoing declines among high consumers being replaced by low consumers does not pencil.
Perhaps it’s time to consider what role the Federal Reserve and developed nation central banks have had in this collapse…particularly versus the Chinese population control approach of a one child policy? The developed nations, via interest rate policy, appear to have achieved consistently lower birth rates than China’s autocratic approach. Given the stated central bank focus of environmentalism, clearly the most important component in controlling emissions, resource depletion, etc. is controlling the quantity of consumers (particularly among those that have high rates of consumption). It has been five decades in the turning of this ship…but now organic demand (quantity of 0 to 65 year old consumers w/ capability to consume) is set to fall indefinitely. Absent the population/consumer growth of the consumer nations, there is no transmission mechanism for lower middle and low income nations to export there way to higher gross national incomes, per capita. In fact, the lower middle and low income nations are likely to see their portion of the pie begin falling dramatically as developed demand for their goods and labor consistently wanes.
Below, the female childbearing populations of the differing income groupings. The long declining female childbearing populations of the developed (despite immigration) coupled with severely negative fertility rates versus the decelerating childbearing growth and decelerating fertility rates of the lower middle (India, etc.) and low income groupings. Like most things, there is likely a tipping point at which the lack of organic population/consumer growth can no longer be hidden by debt and population growth among the poor and elderly. We are likely there.
Seventy years of Federal Reserve interest rate policy managing the dollar as the global reserve currency…with two distinct periods. Thirty years of interest rate hikes, followed by 40 years of interest rates cuts. Below, I chart this interest rate against the basis of global demand represented by the high and low income global child bearing populations, and resultant debt that declining rates have fostered.
Looking at the same groupings, but on a year over year change basis. It appears that changing global demand (inflation) and the annual change in the global childbearing consumer population have moved in sync for…seven decades. This doesn’t seem to be a coincidence. Essentially, rates were hiked while demand growth was rapidly rising, suffocating commensurate capacity growth…pushing inflation and turning a growing population away from further population growth. Then as demand growth was decelerating, rates were dropped encouraging oversupply of new capacity…and deflation. Almost simultaneous to the onset of the declining childbearing population, ZIRP was initiated. ZIRP has ushered in asset hyper-inflation (enriching primarily institutional and elderly asset holders) amid stagflation and population decline among the consumer childbearing population…and decelerating growth among the low consumer nations childbearing population.
Looking at the wider consumer vs. low-consumer under 65 year old populations, FFR%, and resultant debt. The consumer supertanker, that is the consumer under 65 year old population, has turned downward…even inclusive of immigration (factored into the chart below). The decades of interest rate cuts until arriving at ZIRP and the resultant inverse relationship of debt growth are fairly easy to see…and only when viewing their impact on population growth can their true purpose be seen.
Looking at the same as above, except on a year over year annual change basis. ZIRP, exploding debt (resulting in asset hyper-inflation), and global consumer depopulation are no coincidence.
Lastly, where the majority of global population growth is happening among the elderly…essentially an echo of where the world was almost seven decades ago except this population is living decades longer than the generations that came before them. But growth among this population is massively deflationary as elderly are credit averse and tend to pay down/off their debts…essentially destroying currency faster than the young population can create money via new debt.
It would appear that the seven decades of global reserve currency management coinciding with the unprecedented downturn in fertility, births, and population growth are highly correlated. The power to artificially determine interest rates, rather than trust in a free market, has reverberations throughout business, finance, and economics. But interest rate policy also seems to have guided birth rates and ultimately the population of this planet. Like most things, I doubt the Federal Reserve would even dignify this with a comment or discussion…but the data suggesting the Federal Reserve (BoJ, ECB, BoE, etc.) has, is, and will likely continue to be guiding depopulation (in like goal to China…but differing in method), while simultaneously choosing winners/losers for decades to come, seems fairly compelling.
In case there are still those that wonder at the transmission of declining interest rates/ZIRP…to debt creation…to asset appreciation…absent resultant GDP growth…please study the charts below charts of the Wilshire 5000 (representing all US equity) which has now doubled GDP. And finally the impact of shifting wealth to the few on the births among the many.
Focus on the Wilshire 5000 (representing soaring US asset inflation).
Finally, who is winning/losing based on asset inflation…chart below shows surging net worth of the top 10% of Americans (now owning over 70% of total wealth) versus declining portion among those with little to no assets (bottom 90% of Americans now holding less than 30% of the pie).
Portion of net worth by top 10% / bottom 90% versus annual US births.
Gauging US annual births (regardless parents status as legal/illegal) versus Federal Funds Rate, US marketable debt, Federal Reserve’s balance sheet (below).
And dividing the future responsible for paying/servicing that debt (annual births) vs. the sins of the past that will be their lifelong yoke. Looking more like Bitcoin or what gold/silver would look like if their paper versions weren’t being rehypothecated even faster than currency dilution. At some point, young will refuse to carry that weight any longer (and the $ will likely suddenly, violently become worthless in terms of fixed quantities of things like physical gold/silver).
Invest accordingly!!!… even if it may be the foundation of the second American civil war (dancing in an immoral system as long as the music plays)!?!
Tyler Durden
Tue, 02/16/2021 – 13:09
Read More