

This article was written by Wolf Richter and originally published at Wolf Street
For most Americans, housing costs are the largest item in their budget, ranging from 30% to 60% of their total monthly spending. In its Consumer Price Index (CPI) for February, released yesterday, the Bureau of Labor Statistics reported that the costs of homeownership (which the BLS calls “Owner’s equivalent rent of residence”) have increased by just 2.0% from a year ago, and that rents (“rent of primary residence”) have increased by 2.0%. They’re the biggest items among the 211 items in the CPI basket and together account for about one-third of overall CPI. They play a huge role in CPI. So…
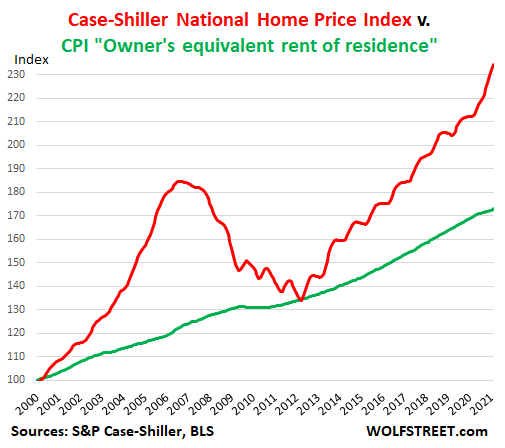
Rent inflation of 2.0% year-over-year on average across the US might be roughly on target, from what I can see in other rental data. But homeowner’s inflation of just 2.0%, given the skyrocketing home prices? Ludicrous. In its latest release, the Case-Shiller National Home Price index jumped by 10.4%.
This discrepancy between home price increases and the CPI for homeowners – which has for years contributed to understating the overall CPI – is depicted in the chart of the Case-Shiller National Home Price Index (red line) and the CPI for “owner’s equivalent rent of residence” (black line). I set the homeowners CPI at 100 for January 2000 to match the Case-Shiller index, which is set by default at 100 for January 2000. This allows you to see the progression of both indices on the same axis.
The thus corrected CPI increases by 3.7%.
The “owner’s equivalent rent of residence” accounts for 24.2% of CPI. If it had increased by 10.4%, in line with the Case-Shiller index, instead of 2.0%, the overall CPI would have increased by 2.03 percentage points more. So add the 2.03 percentage points to the reported overall CPI increase of 1.7%. And the thus corrected overall CPI would have shot up by 3.7%!
During the Housing Bust, after five years of dropping, the Case-Shiller Index briefly joined the CPI for homeowners before taking off again – and there is a reason for that we’ll get into in a moment.
The S&P Case-Shiller Home Price index is a good measure of house price inflation because it is based on the “sales pairs” method, comparing the price of a house when it was sold in the current month, to the price of the same house in prior transactions years ago. It also accounts for improvements and removes outliers. In other words, it measures how many dollars it takes to buy the same house over time – and thereby it measures house-price inflation.
This discrepancy – in reality, a form of purposeful deception – between actual home price increases and the CPI for homeownership has been bemoaned before and is not a secret. But it’s not broadly discussed in the media so that everyone knows by just how much the homeownership component in the CPI understates the actual homeownership inflation that Americans confront.
To its credit, the BLS includes homeownership costs in the CPI basket. By contrast, the EU does not include homeownership costs at all in its basket underlying its Harmonised Index of Consumer Prices (HICP). It only includes rent. And thereby housing costs are woefully underrepresented in the EU’s inflation data.
The rationalization put forth by the BLS for this discrepancy is that it doesn’t actually consider house prices relevant for inflation. It considers houses an “investment,” and investments don’t enter into the CPI. What it does try to put a price on is the cost of “shelter,” which is a service. This makes sense with rent. A renter pays for a service. But the BLS extrapolates this rent-as-a-service to homeownership. And that’s where the logic croaks.
The BLS housing inflation data is based on the “Consumer Expenditure Survey” sent to consumers, rather than market data for prices and rents. It’s up to the homeowner to decide what their primary residence would rent for it they tried to rent it out.
This is the question in the survey: “If someone were to rent your home today, how much do you think it would rent for monthly, unfurnished and without utilities?” So homeowners have to come up with some figure.
For the CPI, the BLS says, the cost of shelter of the owner-occupied home “is the implicit rent that owner occupants would have to pay if they were renting their homes.”
This explains the black line in the chart above that is completely out of tune with the reality of home prices: It tracks rent inflation, not house price inflation, and it essentially represents what homeowners think rents would be. So the rent CPI, which accounts for 7.8% of total CPI, and the homeowner CPI, which accounts for 24.2% of CPI, measure roughly the same thing: rents. And this thereby neatly and purposefully excludes rampant house price inflation from the index. And it also turns CPI into the sad joke that it is.
The post House Price Inflation in CPI is of Course Complete Baloney, but it Accounts for 1/4 of Total CPI appeared first on Alt-Market.us.